
All statistics courtesy of BrightMLS.
Due to the shifting of this year's market timeline due to Covid-19, it was expected that the fourth quarter wouldn't have the typical slowdown it does in most years (and especially in years with an election). Here are the final results of the last quarter of 2020.
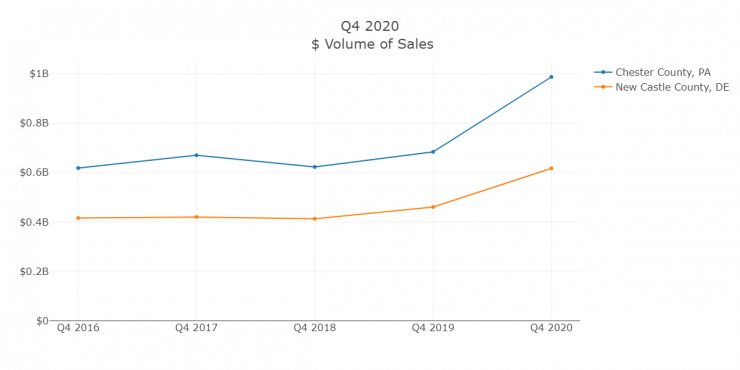
As expected, the overall market was way up compared to previous fourth quarter results.
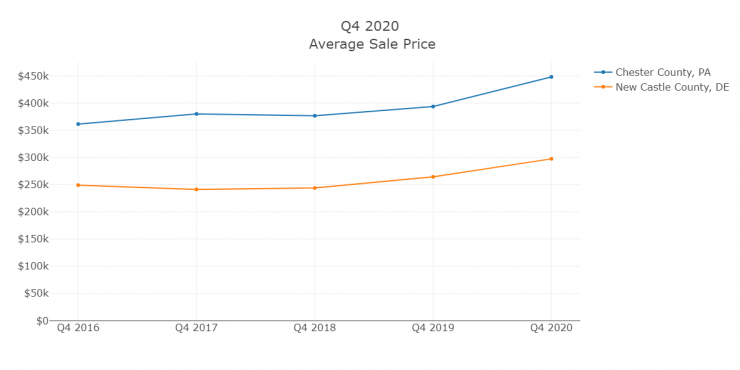
Average Sales price also continued it upward trend, as the number of available properties has remained low.
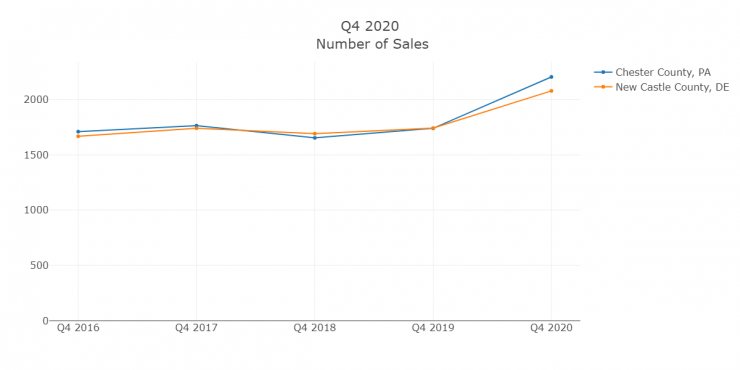
Number of sales was significantly higher than the very stable previous 5 years, where it was quite consistent.
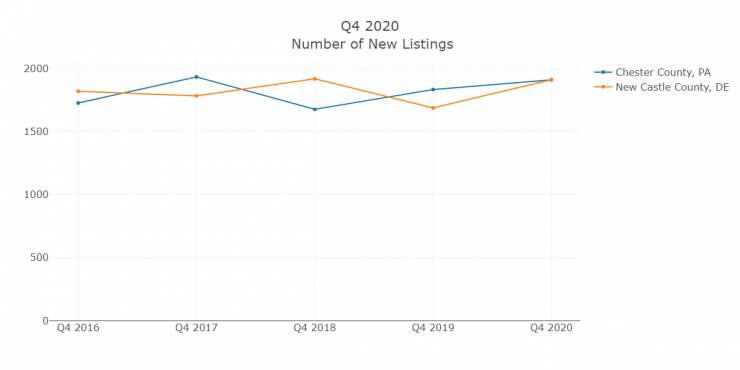
Number of new listings has stayed fairly reliable over the last 5 years, especially as the holiday season does not tend to lend itself to people putting their homes on the market as often.
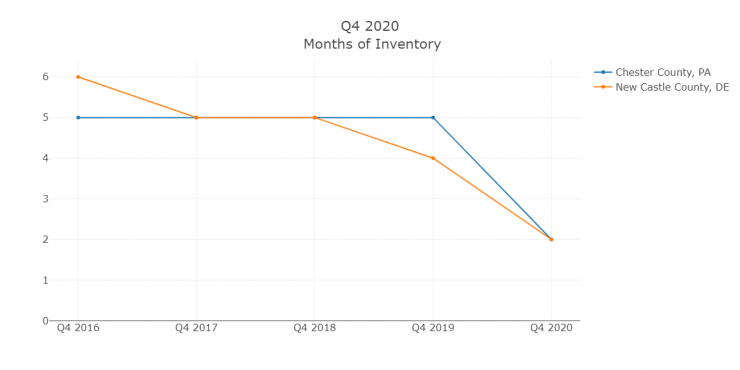
Months of inventory has just been plummeting as there have been a lot of sales, but not a ton of new properties available. What is rather interesting about this is that a lot of sellers are typically also buyers, so you would expect a more consistent turnover. This likely means that the purchasers are new to the market, investors, or people who are seeking additional properties.
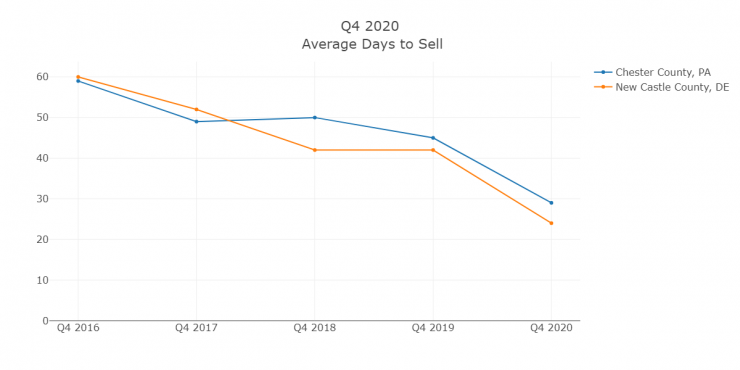
As can be expected with so many sales but low inventory, time on the market is down remarkably over the last 5 years, halving in a very short time range.