All statistics courtesy of BrightMLS.
One of the more illuminating ways to look at the real estate market is by price range. The reality is that people who are listing at different price points will have drastically divergent selling experiences, and that shapes their personal view of what the overall market may be like. However, it's useful to see how other price ranges may have contrasting viewpoints.
For this post, we are also going to look at some new graph styles. We will start with the typical by county year in review. After that, we will look at the last five years for each county in turn, to get a more historical perspective on how things may have shifted and to see if there are any insights that may come up from that data.
Let's start with the more timely last year first.
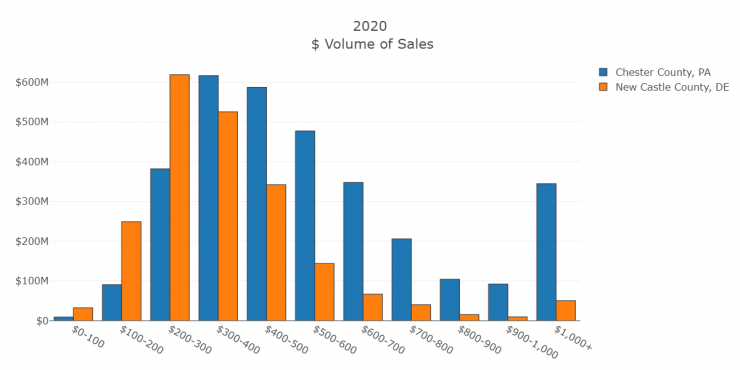
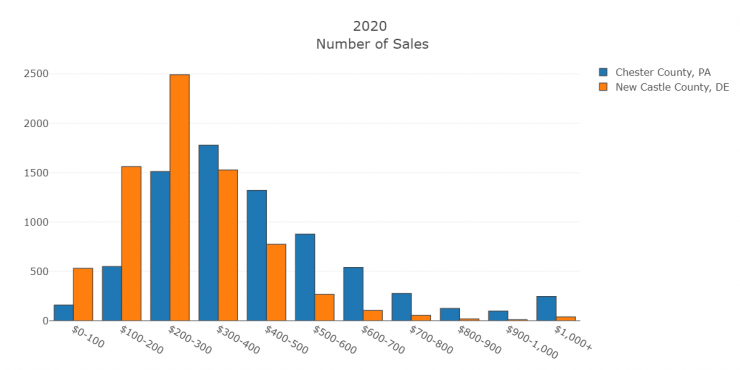
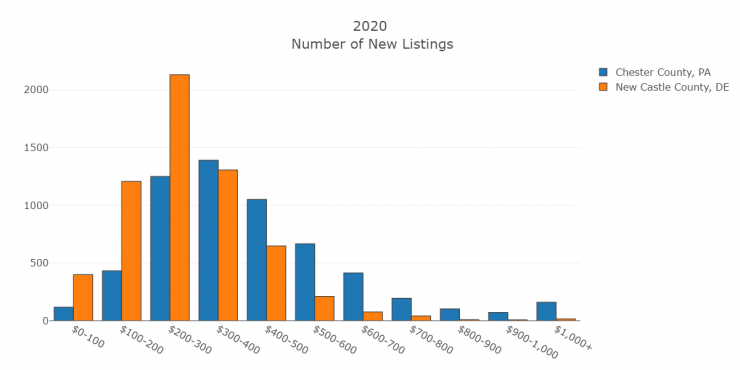
2020 Price Ranges by County
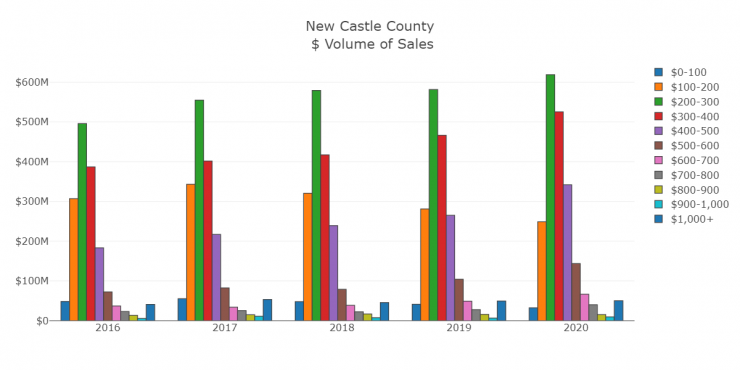
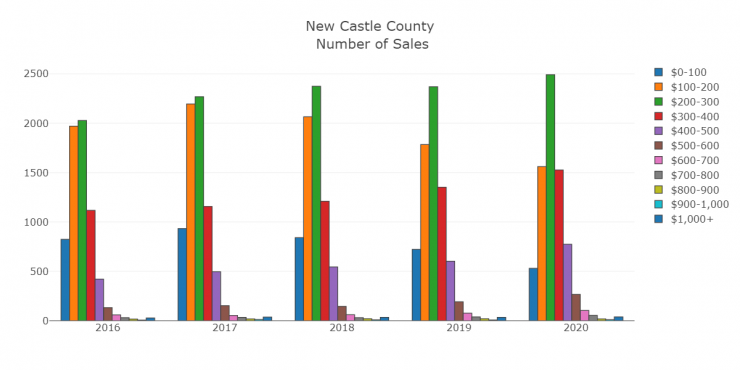
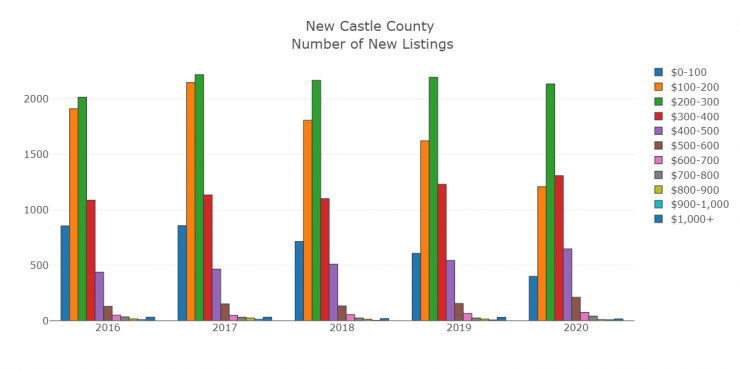
Historical Price Ranges - New Castle County
Let's take a look at the historical price ranges for the last 5 years in New Castle County.
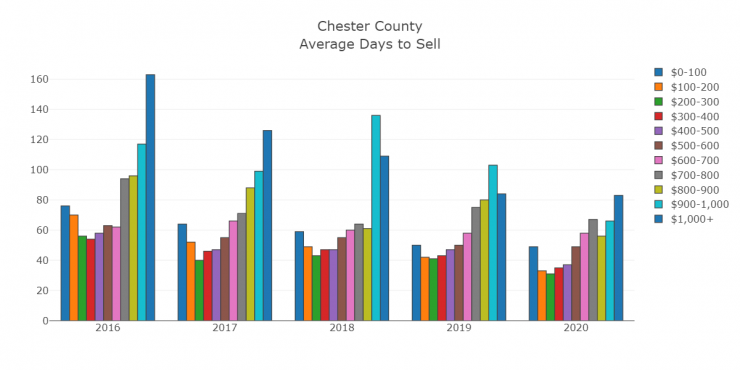
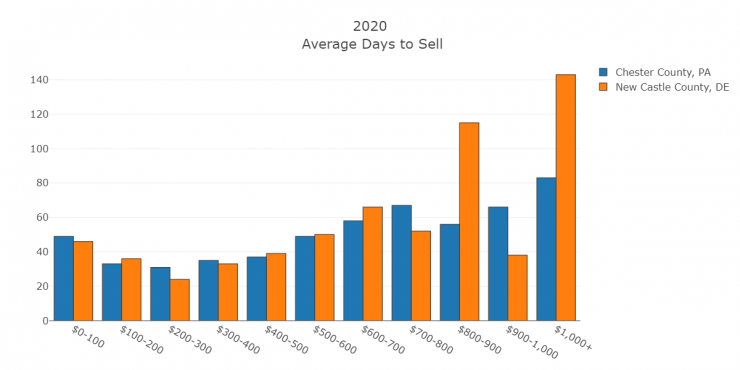
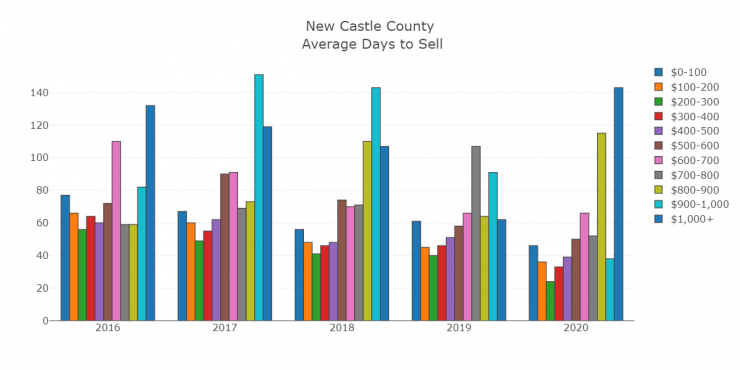
Now onto how that will affect days to sell.
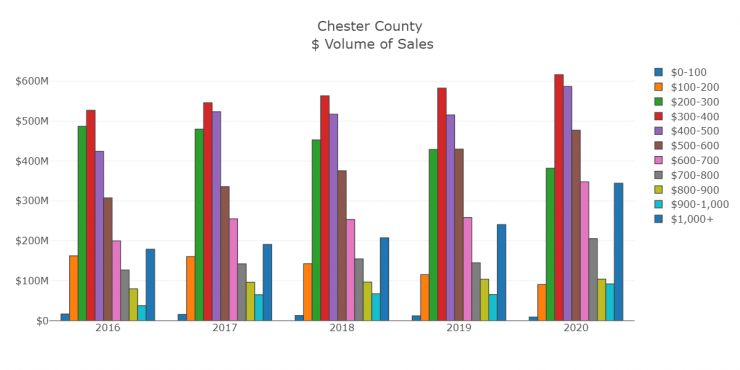
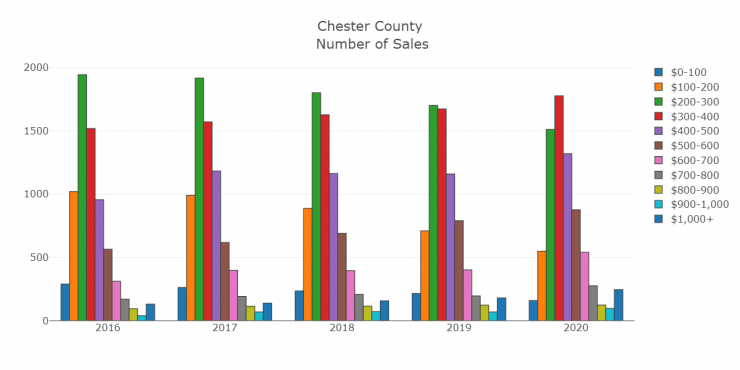
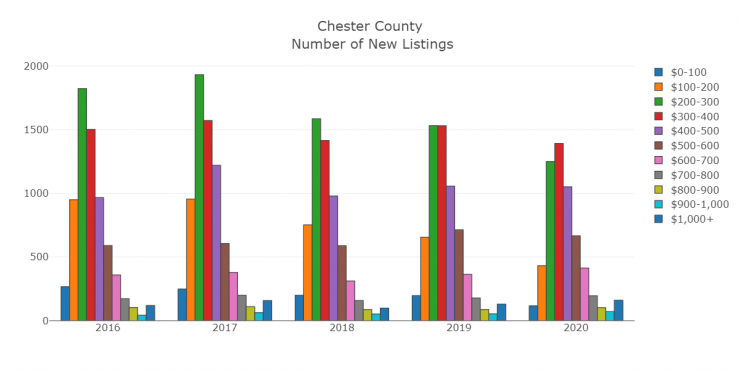
Historical Price Ranges - Chester County
It will be interesting to see if there was a slowdown in any price ranges over the last year for any price ranges, due to the real estate market completely shutting down in Chester County. Let's see if there was any significant change in overall volume.